Customer Lifetime Value (CLV or LTV) is one of the key performance metrics for every SaaS company. Your CLV represents the average amount of money you can expect to earn from a customer over the duration of their engagement with your product.
There are many benefits that come with knowing your business’ CLV:
- Efficient budgeting: It lets you know how much you can spend to acquire customers and still generate profit from the user acquisition, and/or stay within budget for generating user base growth.
- Identify optimization opportunities: Your CLV can help you identify where customer success is having a positive impact on users, and areas that would benefit from optimization efforts.
- Predict churn: Customers with a high lifetime value are less likely to churn. They have had previous success with using your product or service and know that it meets their needs.
Related content: Learn how to improve CLV by optimizing retention. Get your user retention guide here.
How to Calculate Customer Lifetime
Generally you will want to first know how to calculate customer lifetime using the formula:
Customer lifetime = 1/churn rate
What this means is that if your monthly churn rate is 1%, then your customers are expected to stay with you, on average, for 1/1% = 100 months (8 years and a bit).
Because there can be a number of different variables from business to business, it’s important to note that this is the most simplified way to calculate customer lifetime.
How to Calculate Customer Lifetime Value
(CLV or LTV)
Next is digging into customer lifetime value. While there are a few different ways to approach calculating CLV or LTV, they all start with with the following customer lifetime value formula:
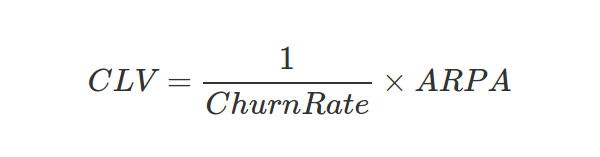
| CLV: Customer Lifetime Value |
| Churn Rate: The rate at which customers cancel their subscription |
| ARPA: Average revenue per account (customer) for a defined period of time (eg, monthly) |
- David Skok: What’s your TRUE CLV?
- Forbes: CLV: The Only Metric That Matters
Working with a particular company, we recently calculated four different values for CLV, depending on the data source(s) we used:
- Calculation 1 = $162
- Calculation 2 = $222
- Calculation 3 = $814
- Calculation 4 = $1333
That’s quite a range. Why so much discrepancy?
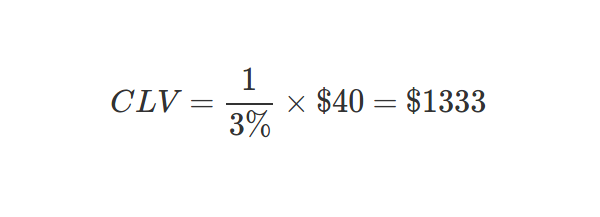
The first value we found was $1333. The reaction we got to this CLV was: it’s too good to be true! (Insider tip: a reaction like this is usually a sign you should investigate further.)
The company’s dashboards reported a churn rate of 3% and an ARPA of $40. So, calculating CLV should be a simple three-minute task, right?
Not so fast.
Common problems with the traditional CLV formula
One unwritten law of science says that for something to be true, it needs to be true from every angle. You can’t just zoom in on black and white stripes to determine if an animal is a zebra or a white tiger, for example.
The company we worked with has been in business for over seven years, so we wanted to see how the customer lifetime value of $1333 matched the actual average revenue generated by users who were no longer customers.
The lifetime of a user is calculated as 1 / Churn Rate, so in this case the lifetime is 33 months, or a little less than three years. This means we have enough users who’ve already churned to calculate how much each of them spent on the company’s products.
We exported eCommerce data on all of the ex-customers, including how much they spent with the company, to calculate both an average and a distribution for this group. There were more than 20,000 users in this churn group, giving us enough data to consider our results relevant.
The average amount each customer spent with the company was under $180. Here’s what the distribution looked like:
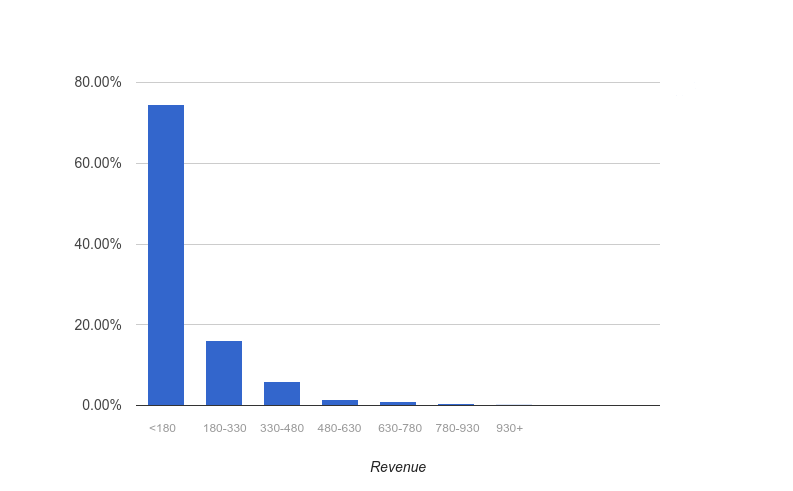
How do we explain this to the company? We just found out that all of the users who left the company over the last seven years spent an average of $180. But earlier, we estimated that the company’s current users would end up spending more than $1300.
In the words of our famed mathematician: something doesn’t seem right.

When we calculated the $1333 CLV, we were using aggregate data provided by a range of different tools. To validate this figure, we needed to try and re-calculate churn and ARPA from scratch.
The company we were working with sells a FinTech product designed for small businesses or solopreneurs with a monthly subscription. Customers can choose to buy a yearly subscription at a discount, or buy different add-ons with a one-time payment.
The churn reported in the company’s dashboards wasn’t separated between monthly and yearly users or add-on purchases. The average revenue per account was calculated as revenue divided by number of customers, but customers with annual subscriptions had a significant impact on this metric.
Armed with this background information, we understood that we had one thing left to do: calculate churn and ARPA just for monthly customers.
How to Calculate Monthly Churn
To calculate monthly churn, we need to know how many customers we have on the first day of a given month. We determine that by counting the number of unique customers who paid for a monthly subscription – new acquisitions plus renewals – in the previous month.
Churn Rate Formula
Churn Rate = (Users at Beginning of Period – Users at End of Period) / Users at Beginning of Period
To calculate the churn rate, we count the number of monthly subscriptions that expired during the current month (Users at Beginning of Month – Users at End of Month) and divide it by the number of customers at the beginning of the month.
With this formula, we calculated the CLV to be $162. This was far less than the initial calculation and seemed too bad to be true.
We wanted to be sure that this churn rate was correct, so we verified that users whose subscriptions had expired didn’t purchase a different subscription later. It turned out that a considerable proportion of users (roughly 10%) exhibited this behavior.
We then recalculated churn rate by removing the users who bought something later, since they didn’t churn after all.
The final value for the churn rate was between 10% and 12%.
Calculate ARPA
Because we calculated the customer lifetime value only for users with monthly subscriptions, ARPA needs to represent how much a customer spends on average during a given month.
ARPA Formula
Monthly ARPA = Monthly Revenue from Subscriptions / Total Customers
Calculating ARPA is easy as long as you filter your data correctly. For monthly ARPA, divide the revenue generated from monthly subscriptions by the number of monthly customers.
We discovered that the true ARPA value was between $23 and $26, not $40 as reported initially. The $40 figure included one-time purchases and yearly subscriptions, which skewed the data by almost 100%.
So, with the new numbers in place, here’s the CLV for monthly users:
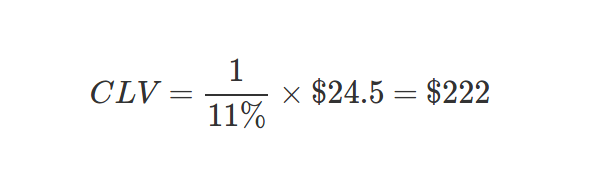
That figure closely matches our analysis of users who’ve already left the company. The company’s price increase over the last year is also clearly reflected in this CLV.
What about those yearly subscriptions?
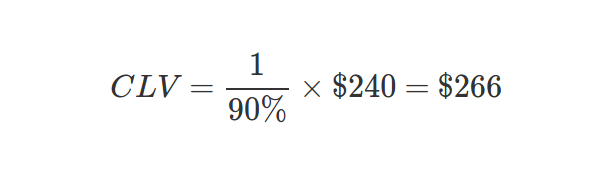
To calculate CLV for annual subscriptions, we needed to answer this question: How many yearly subscribers renew? It turned out the annual renewal rate was less than 10%, giving us a 90% churn rate.
The second question is how much people spend on average on their yearly subscriptions. The answer: $240.
So, CLV for the yearly subscriptions:
One step further
The final step is to calculate the CLV based on acquisition channels. Clearly, not all users are the same.
For the company in question, organic channels generated more than 60% of customers, who had a lifetime value of $255, while paid channels generated 40% of the customers, who had a lifetime value of $172.50.
This breakdown gave the company a much clearer view of what their cost of acquisition should be per channel.
What assumptions are made when calculating CLV?
- Marketing conditions remain fixed: The standard CLV formula assumes that market conditions will remain the same during the lifetime of the customer’s relationship with your product or business. As more competitors arise on the market and look to have an edge, pricing may need to be adjusted accordingly.
- Revenue per customer is not growing: The standard CLV formula assumes that the revenue per customer will not grow or increase over time, however, you could see an increase in revenue per customer if you introduce new services over the span of your relationship that they will need or want to purchase.
- Considers customers as average: The standard CLV formula assumes that your customers are mostly uniform. However, as you optimize your product’s sales model, metrics such as your churn rate may have changed, and therefore your previous data is no longer reliable.
Looking for deep insights into how your customers use your product?
There are many benefits to knowing your CLV – and, on the flip side, not having a good grasp on it can be detrimental to your growth strategy.
However, the CLV by itself as a metric can only tell you so much about the health of your customers and your business.
Check out these other product metrics to accurately find optimization opportunities within your product and improve retention – and see how a product analytics tool can help you achieve that.